Overall work flow and software architecture
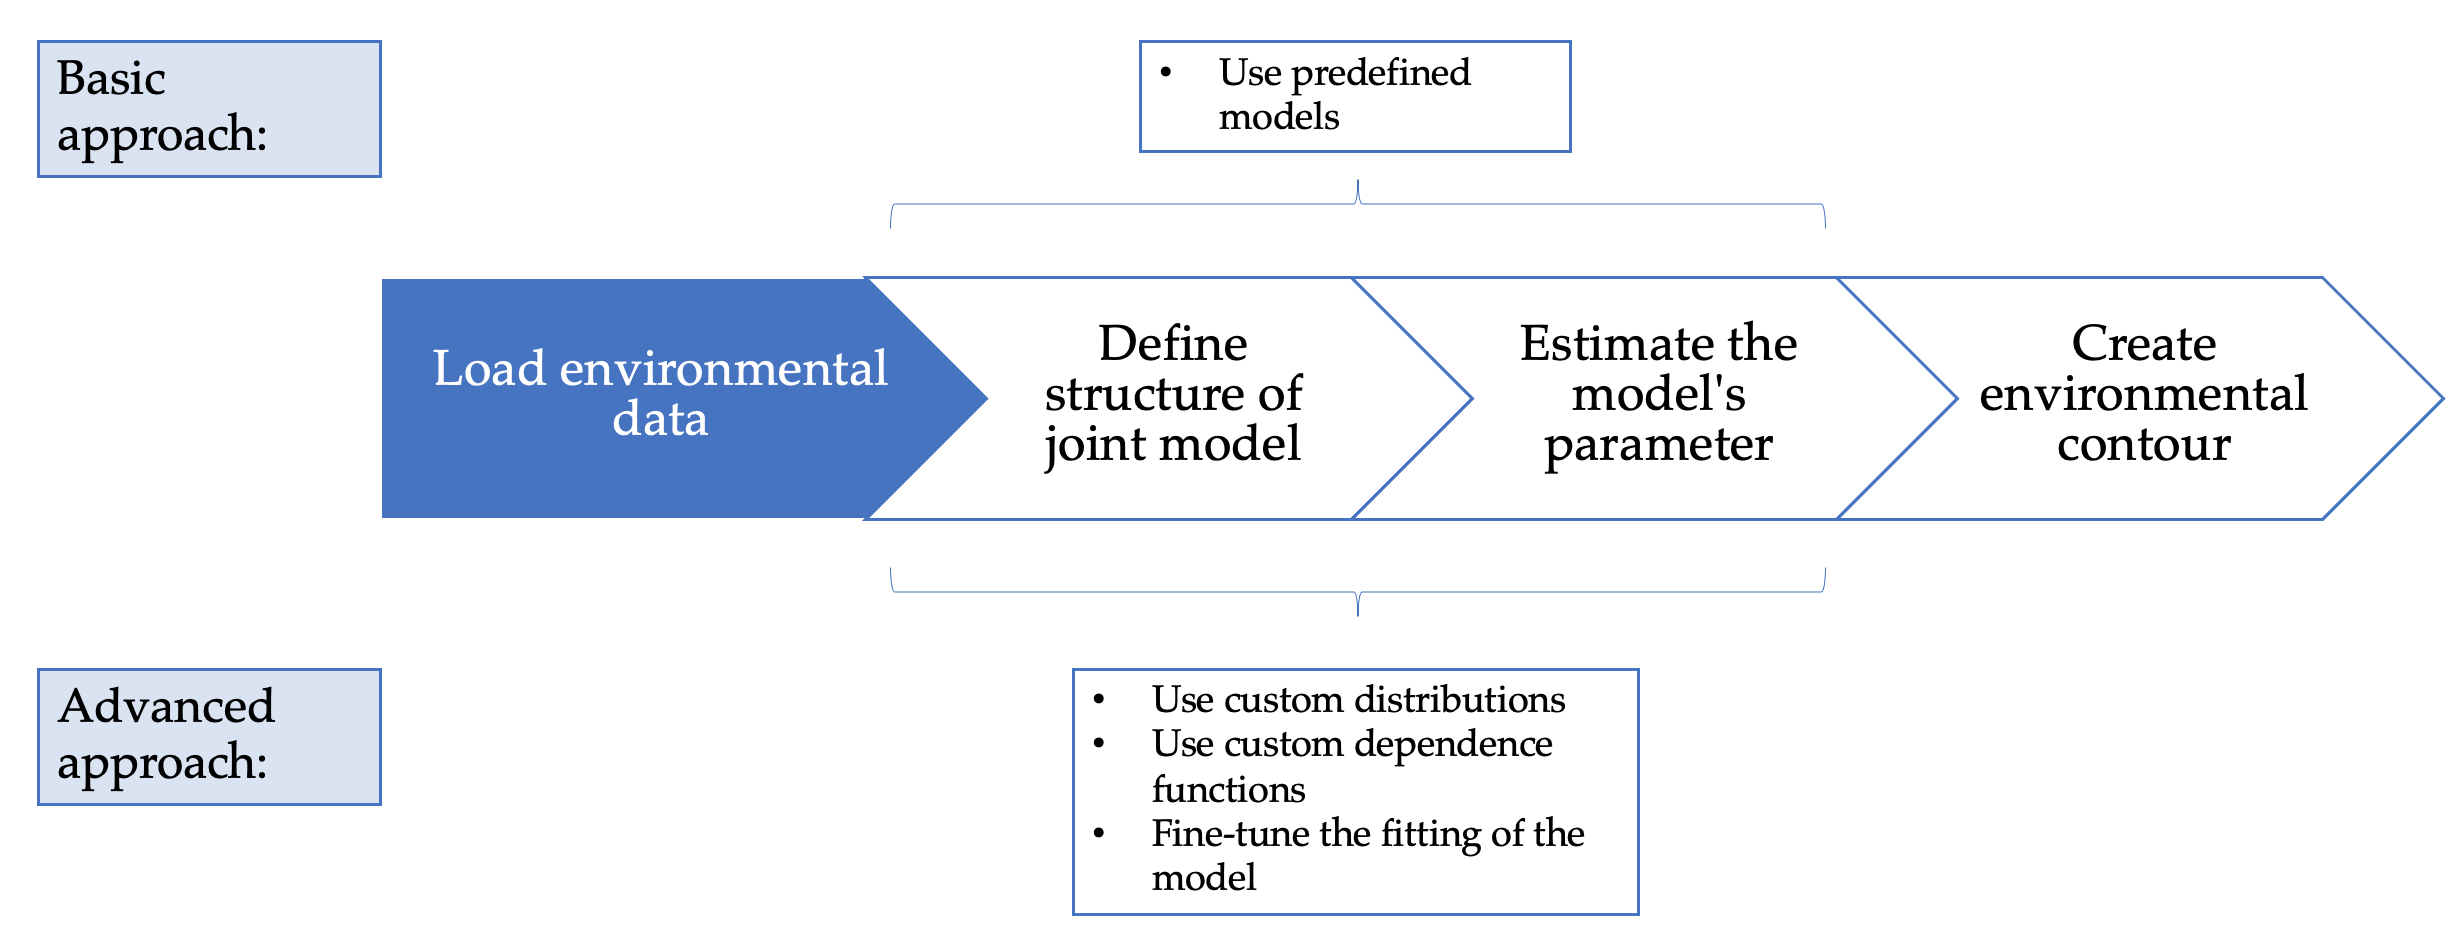
Figure 1 shows a flowchart that captures the overall functionality of virocon. A statistical model of the (offshore) environment can be created by fitting a model structure to measurement data. Then, this statistical model can be used to construct an environmental contour.
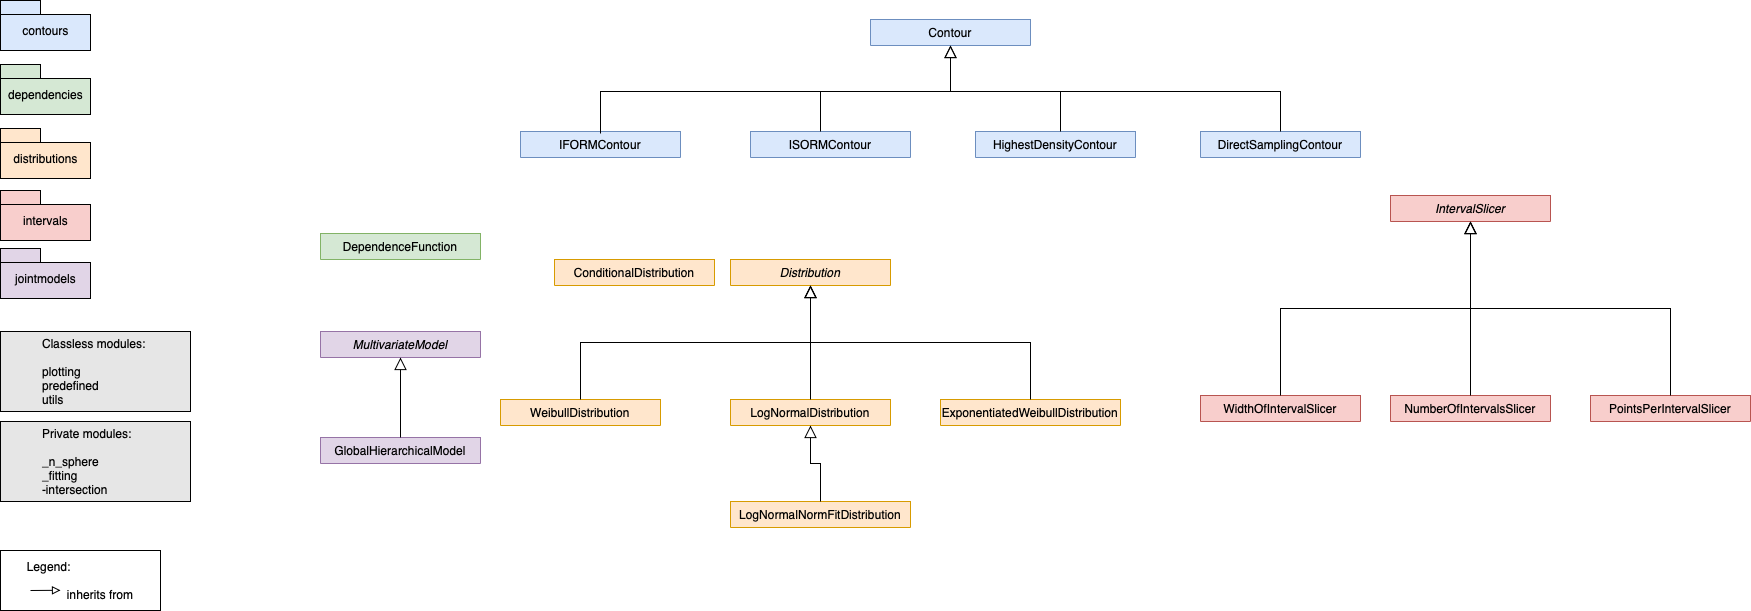
The class diagram is showing among others the class MultivariateModel, which handles fitting a model structure to a dataset, the class DependenceFunction, which handles the dependencies between the environmental variables and the class Contour, which handles contour construction. This class diagram was created for virocon version 2.0.0
Figure 2 shows virocon’s class diagram.